

Andrew Macdonald, Uber’s COO, said in May that the company was struggling to connect increased AI usage with a proportional increase in useful consumer features. Uber had already exhausted its 2026 Claude Code budget, according to reporting on its CTO’s April remarks.
By August, Uber was reporting lower token costs alongside wider employee adoption of frontier AI tools.
That is progress on efficiency. Establishing the business impact of what those tools help people build requires another measurement.
Garry Tan has argued that founders should give themselves permission to spend heavily on agents, estimating $50,000 to $100,000 a year for intensive use. His argument is that the experience can help founders discover capabilities and workflows ahead of broader adoption.
Yamini Rangan at HubSpot has argued for outcome maxxing, explicitly pointing to customer growth and better business workflows. Salesforce introduced Agentic Work Units to count discrete tasks performed by agents. Adaline Labs’ August 15 article proposes return on tokens, with cost per successful outcome as the operational measure. ·
These arguments already recognize that usage alone says little about value. For product teams, we think the next step is to follow that measurement through to the work that ships and the outcome it delivers.
Put the token bill next to the work it informs
Consider an illustrative five-engineer team. Assume $1.3 million in annual engineering cost, equivalent to $260,000 per engineer including overhead. Spread across 26 two-week sprints, that is $50,000 per sprint. Add $15,000 for PM time spent gathering and checking feedback, and $12,500 for feedback-analysis API usage.
The annual modeled cost is $1,327,500. Feedback-analysis API spending represents 0.94% of it.
These are scenario assumptions, not measured industry averages. The API line covers feedback analysis only. It excludes coding agents and other AI usage, and this simplified model leaves out other product-delivery costs such as design and additional infrastructure. It cannot tell us what share of a company’s total bill goes to tokens.
It can show why a product team should look beyond the price of processing feedback. The engineering work that feedback informs can cost considerably more.
Two measures worth adding
Decision yield is our proposed measure for the share of shipped initiatives that achieve a predefined outcome within an agreed measurement window.
Cost per successful outcome is the cost allocated to that same cohort of initiatives divided by the number that achieve their outcome.
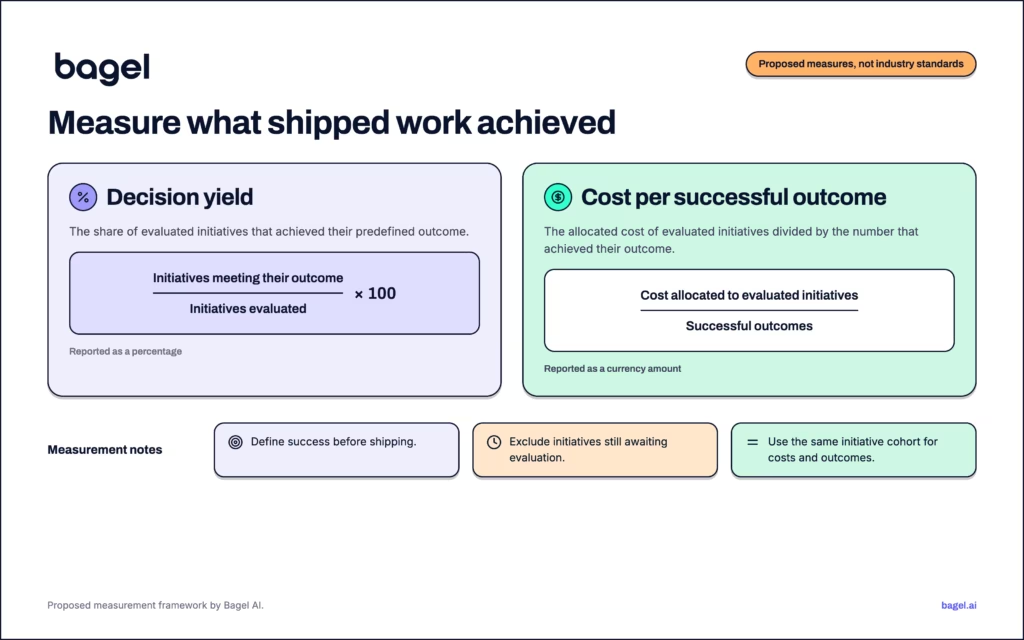
Define the goal, minimum meaningful improvement, measurement method, and evaluation window before shipping. Keep work that is still awaiting measurement separate from confirmed successes and misses. Reliability, security, and maintenance work need criteria appropriate to their purpose. A lack of measurable conversion lift does not make every other kind of work a failure.
Experimentation research gives teams a reason to measure their assumptions. Ronny Kohavi has reported that roughly a third of experiments at Microsoft produced statistically significant positive results, with a lower 10–20% success rate at Bing.
GrowthBook’s account of a webinar with Kohavi reports a roughly 10% median experiment success rate. That is useful context, but it does not establish the success rate of shipped initiatives at a typical product company. Experiments include treatments that never reach full rollout. An inconclusive result also does not prove that an initiative has no effect.
Pendo’s 2019 study of 615 subscriptions found that 80% of features in the average product were rarely or never used. That measures adoption, which also needs to be interpreted against a feature’s intended purpose.
Your team needs its own baseline.
What the model shows
For the arithmetic, assume the team delivers 13 similarly sized initiatives a year, averaging two sprints each, and that each has a 10% probability of meeting its outcome. Those are hypothetical inputs. This also simplifies away differences in project size, support work, and the value of individual outcomes.
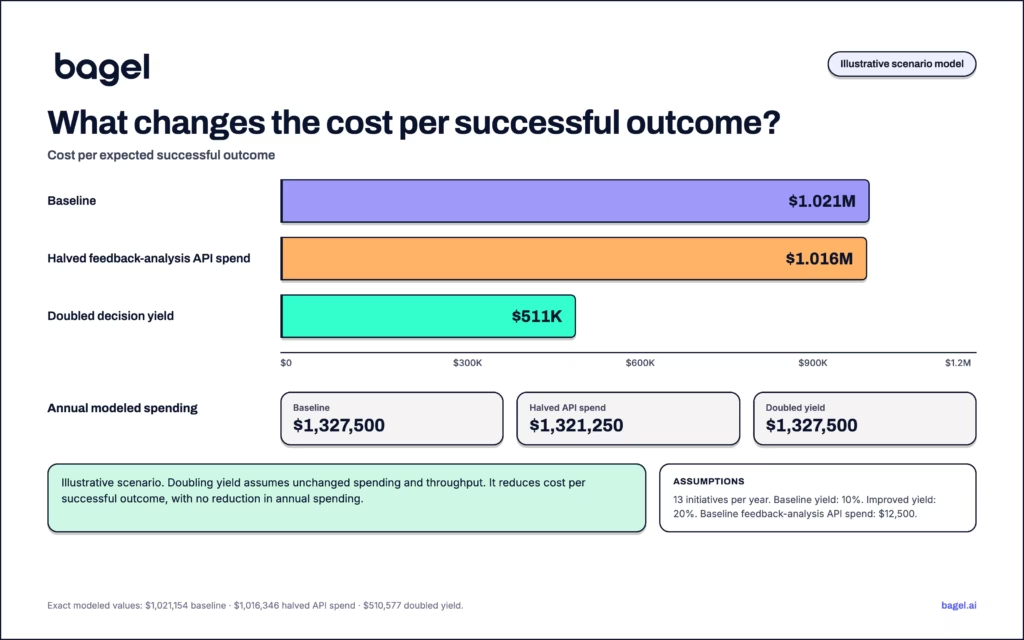
The expected number of successful outcomes is 1.3. Dividing $1,327,500 by 1.3 gives approximately $1,021,154 per expected successful outcome. The fractional count is a planning expectation, not a claim that a team can ship 1.3 successful initiatives in a particular year.
Halving feedback-analysis API spending reduces the annual budget by $6,250, to $1,321,250. With yield unchanged, cost per expected successful outcome falls to approximately $1,016,346, a reduction of $4,808.
Now model yield rising from 10% to 20%, with the same throughput and spending. Expected successful outcomes increase to 2.6, and cost per expected successful outcome falls to approximately $510,577.
Annual spending remains $1,327,500. The improvement is more successful outcomes from the same budget. It is not $510,577 returned to the bank account.
The comparison also holds across these higher API-spend scenarios. All other assumptions remain fixed, and figures below are rounded to the nearest $1,000.
| Annual feedback-analysis API spend | Cost per expected successful outcome at 10% yield | After halving API spend | After increasing yield to 20% |
|---|---|---|---|
| $12,500 | $1,021K | $1,016K | $511K |
| $37,500 | $1,040K | $1,026K | $520K |
| $62,500 | $1,060K | $1,036K | $530K |
| $125,000 | $1,108K | $1,060K | $554K |
In the $125,000 scenario, halving API spending removes $62,500 from the annual budget and reduces cost per expected successful outcome by about $48,077. Doubling yield reduces that unit cost by about $553,846 while leaving annual spending unchanged.
The larger potential improvement deserves attention. It does not establish which change is easier or should happen first. Doubling yield may require additional research, tooling, experimentation, or engineering time. Those costs belong in a real comparison, as does any change in delivery speed or the value of the outcomes achieved. Nothing in this model establishes that Bagel, or any other tool, doubles yield.
Read the token research carefully
Two claims in Adaline’s article need narrower interpretation.
The article uses METR’s time-horizon chart to argue that agents become less reliable the longer they run. METR defines time horizon using the duration of the equivalent human task, not elapsed agent runtime. A 50% time horizon represents task difficulty at which the agent succeeds half the time. METR also describes substantial uncertainty, with historical error bars roughly a factor of two in either direction and potentially wider intervals as benchmarks saturate.
Adaline also applies a 1,000× token comparison broadly to agents. A study by Bai and colleagues reports that scale of difference for agentic coding on SWE-bench Verified compared with code-chat and code-reasoning tasks. It is not a universal multiplier for every agent workflow. Gartner separately reports 5–30× more tokens per task for agentic models than a standard GenAI chatbot. The comparisons cover different settings.
The coding study also found that accuracy often peaked at intermediate cost and that models struggled to predict their own consumption. Its strongest reported prediction correlation, 0.39, was for output tokens. These observations support measuring actual runs and allowing for uncertainty. They do not make spending caps or budgets pointless, or prove that increasing compute cannot improve a particular task.
What the agent reads matters
Anthropic’s internal analytics work provides a useful example. Without skills, accuracy on its evaluations did not exceed 21%. Adding skills brought aggregate results consistently above 95%. In a separate test, giving the agent retrieval access to thousands of SQL files changed accuracy by less than a point, although answers were present for roughly 80% of its misses.
The team also observed accuracy drift from approximately 95% to 65% over a month before strengthening maintenance. These are results from its internal analytics setup, not a benchmark for product-feedback systems.
The same article reports an accuracy gain of 6% within its evaluation set from adversarial review, at the cost of 32% more tokens. Additional compute can help when it funds a useful verification step.
Our inference for product feedback is that source selection, structure, and maintenance deserve the same attention as model choice. That analogy needs testing in the actual workflow.
Bagel’s published feedback-analysis model applies our production ratios to an illustrative monthly mix of calls, tickets, requests, CRM notes, Slack threads, and surveys. Its tables produce approximately 12.3 million raw tokens and 904,000 structured insight tokens. That is approximately 92.7% fewer tokens in the resulting query dataset, or a 13.6× reduction in its size.
This is a Bagel-authored model, not an independently validated industry benchmark. Extraction and compression reduce the dataset presented for analysis while retaining links to the raw source. Total API cost savings depend on ingestion costs, query frequency, input and output pricing, and caching. Dataset size alone cannot establish them.
There is also a counting problem. One call can contain several product gaps, and the same gap can appear across many calls. Treating transcript rows as the number of customer needs loses that distinction. An analysis pipeline should extract separate mentions, group related needs, and preserve their sources. An agent can do that work, but the workflow has to require and verify it.
What to measure before outcomes arrive
Outcome measurement takes time. These four diagnostics can help teams inspect the evidence informing current work. We propose tracking them and testing their relationship with outcomes, rather than assuming they are proven predictors.
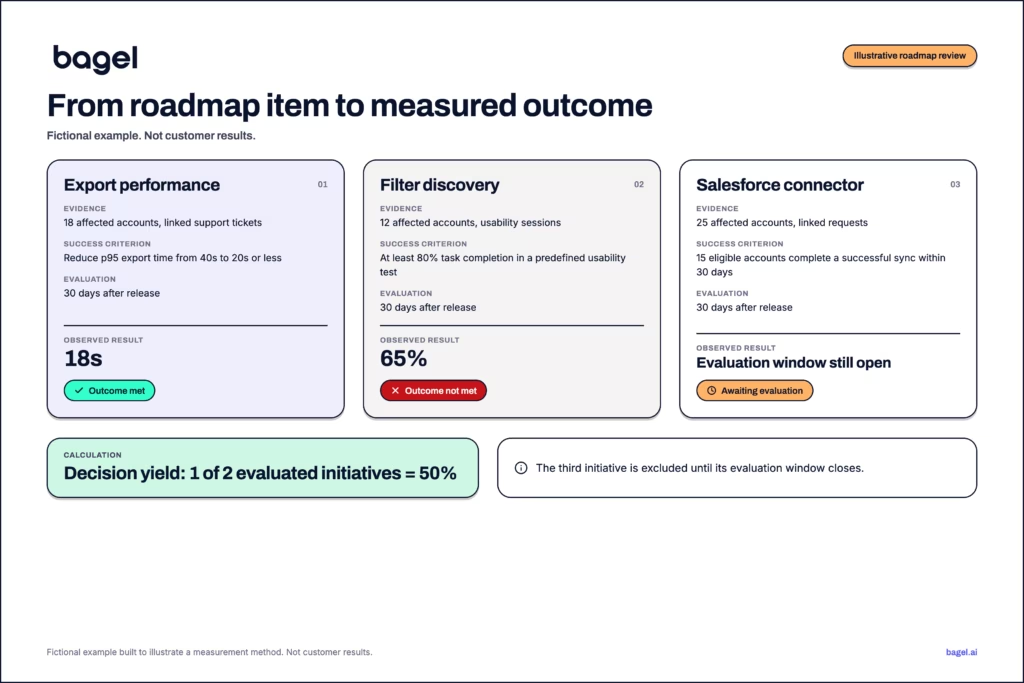
Evidence coverage: the share of roadmap initiatives with linked customer evidence, quantified affected accounts or users, and a documented connection to the intended outcome. Record other valid rationales for work, including reliability and security requirements.
Duplicate work: the share of reviewed initiatives whose intended need is already adequately covered by an existing capability. Investigate whether the underlying issue is discoverability, adoption, or a remaining capability gap before labeling the work redundant.
Signal coverage: the share of relevant feedback mentions that a proposed scope is expected to address. Bagel’s published illustrative example assigns 62% of an integration cluster to a proposed Salesforce connector and 24% to an existing HubSpot integration. Those figures demonstrate the method, not observed customer results or universal thresholds. Weighting by affected accounts or business impact may lead to a different scope decision.
Evidence freshness: the share of evidence and product mappings reviewed within a defined window, with named owners and checks after relevant releases. The maintenance burden belongs in a build-versus-buy assessment. It does not decide that assessment by itself.
Where this leaves the engineers
Model routing, caching, retrieval, and verification all deserve engineering attention. Their value depends on the workflow and the effect on cost, speed, and quality. Exploration can justify substantial spending too, provided teams evaluate what they learn and what becomes useful.
A product team also needs to know whether that work improves the outcomes of what it ships. Track spending alongside delivery cost, outcome attainment, and outcome value. Compare the changes you can realistically make, including the cost of making them.
Start with the current roadmap. For each initiative, record the intended outcome, the evidence supporting it, the affected customers or users, and the date you will evaluate the result. Calculate how many have that record complete. That gives the team a baseline it can inspect, improve, and eventually compare with what happened after launch.