You’ve done this. Exported 10,000 support tickets, dropped them into Claude or ChatGPT, asked something like “what are our biggest customer pain points?” The response came back organized, segmented by theme, with a recommendation at the bottom. It read like the best analyst on your team wrote it.
You shared it. People nodded. Maybe you built a quarter around it.
And you have no reliable way to know whether the model actually analyzed your data or skimmed a fraction of it and wrote something that looks like analysis.
This is a well-documented architectural limitation of how large language models process information. And it has specific, measurable consequences for product teams that rely on AI-generated analysis to decide what to build next.
The attention budget is real, and it’s smaller than you think
Every AI model operates within a fixed token budget per request. Tokens are subword units (roughly 0.75 words per token in English, though this varies by content type). The budget covers everything the model reads (your data) plus everything it produces (its analysis). How that budget gets allocated determines whether you get genuine insight or a plausible-sounding summary.
NVIDIA’s RULER benchmark, one of the most comprehensive evaluations of long-context model performance, evaluated long-context language models across 13 different task types. The finding that matters for product teams: despite achieving near-perfect scores on simple retrieval tasks (the “needle in a haystack” test that every model vendor loves to cite), almost all models showed large performance drops when tasks required actual synthesis across long inputs. This finding is consistent across studies – retrieval is essentially a solved problem, but synthesis and reasoning over long contexts remain genuinely hard.
The gap between the advertised context window, which can reach 1M input tokens in some LLM, and the effective context window, is significant. Performance depends on where relevant information appears in the input and degrades with longer contexts, well before the window fills up.
Chroma’s Context Rot study, published in July 2025, tested 18 frontier models including GPT-4.1, Claude Opus 4, and Gemini 2.5. The study included two types of tasks, both deliberately kept simple: extensions of the classic “needle in a haystack” retrieval test, and a conversational memory benchmark (LongMemEval) simulating retrieval from real agent interaction. The result was clear: every single model exhibited performance degradation as input length increased. Not most. Not the older ones. All of them.
The degradation follows a specific pattern. Stanford and UC Berkeley researchers identified it as Lost in the Middle: models attend strongly to information at the beginning and end of their context window, and poorly to everything in the middle. In their tests, when a relevant document was placed in the middle of the input, accuracy dropped significantly compared to placement at the start or end (a relative decline of roughly 30% in some configurations).
Think about what this means for customer feedback analysis. When you feed an LLM a large batch of CSV data, the position and length effects compound. Information buried in the middle of the input gets less attention. As the total volume grows, overall reliability degrades. Run the same analysis twice and you’ll get different emphasis, different numbers, sometimes different conclusions. Both outputs will look like someone did the work.
Anthropic’s own engineering team published guidance on this exact problem: “Context must be treated as a finite resource with diminishing marginal returns. Every new token introduced depletes this budget by some amount, increasing the need to carefully curate the tokens available to the LLM.”
The model is doing exactly what its architecture allows it to do. The problem is that teams treat the output as comprehensive analysis when the model itself had access to a fraction of the data.
–
The precision-recall problem: counting mentions isn’t counting customers
There’s a precision gap that compounds the problem.
Say you have a simple task: you want to know how many customers have pain points around “integrations”. When you ask your model to search raw call transcripts and tickets for a keyword like “integration,” it returns every line that contains that word. This sounds useful until you realize that most occurrences are support representatives walking customers through existing integrations, documentation references, onboarding checklists, and internal notes. The actual number of prospects who said “we can’t move forward without Salesforce integration” on a discovery call is buried in the noise.
So you start refining. “Find mentions of integrations, but not Slack as we already shipped that.” Then: “Only include internal notes if they reference a specific customer.” Then: “Deduplicate requests from the same account.” Each prompt feels like progress. Each refinement also introduces a new way to lose something important. Which brings you to the other side of the problem: precision was about retrieving too much. What you’ve just created, through all that filtering, is a recall problem – you’re now retrieving too little. The errors don’t announce themselves, you just get a final result that feels clean and might be wrong.
And the deeper problem is that this process never really ends. Getting to the conclusion that a specific missing integration is holding up $800K in pipeline this quarter isn’t a search. It’s an investigation that took hours you didn’t budget for, required judgment calls you can’t fully audit, and will need to be repeated from scratch on the next question.
This isn’t a gap that better prompting closes. Keyword search matches exact terms, so it misses relevant content phrased differently, and surfaces irrelevant content that shares the same words. Embedding-based retrieval improves on this by capturing semantic similarity, but introduces its own precision costs as conceptually related but contextually irrelevant content gets pulled in alongside the signal. Researchers have been working on this trade-off for years, across how we measure retrieval quality, the benchmarks used to evaluate it, and the architectures themselves. It is an active area of research, with new methods and technologies continuously pushing the boundary of what precision and recall are achievable. This is why the problem you ran into with the integrations example isn’t your prompt’s fault – it’s what the best retrieval systems in the world are still working on.
The same pattern applies to every product signal. “Slow,” “crash,” “bug,” “confusing.” Even with prompt refinement, extracting the actual signal requires a much deeper understanding: one that knows your product’s taxonomy, distinguishes between customer-reported issues and agent-generated text, and connects individual mentions to the accounts and revenue behind them.
Another dimension is the sentiment behind a product signal – how critical a feature is to a customer. LLMs are better at sentiment than the lexicon tools that preceded them, but that’s a low bar. “Well, at least the loading screen looks nice.” “We’re evaluating alternatives for next quarter.” “Love how every update breaks something new.” These pass through general-purpose analysis as neutral or positive. The same words also carry different sentiment depending on where they appear: “it works” in a support ticket after three escalations means something entirely different than “it works” on a sales call. As in any AI task, you don’t want a general-purpose model. You want a system that factors in channel, product context, and user context.
The business consequence is direct. A team trusting general-purpose sentiment on a channel that looks “mostly neutral” deprioritizes it. A team with better measurement on the same data might find it’s 40% negative – their most important early warning signal. Same data. Opposite conclusions. Opposite resource allocation.
There’s a related problem that’s easier to quantify. A single piece of customer feedback almost always contains more than one distinct signal. A customer call where someone says “the export is slow, I can’t find the filter, and your docs are outdated” is three separate product gaps in one conversation. A CSV treats it as one row.
We analyzed data across our platform at Bagel AI, looking at how many distinct product gaps a single piece of feedback actually contains for a typical company. These are internal platform statistics, not externally audited research, but they represent patterns across real customer feedback flowing through Bagel across multiple channels and industries.
| Channel | % with gaps | Avg gaps (when present) | Avg gaps (all items) |
| Customer calls | 60% | 2.3 | 1.3 |
| Surveys | 45% | 1.4 | 0.7 |
| Chat (e.g., Slack) | 42% | 1.6 per channel-day | 0.7 per channel-day |
| Support tickets | 15% | n/a | n/a |
Source: Bagel AI internal analysis, April 2026. Numbers represent a typical company on the platform.
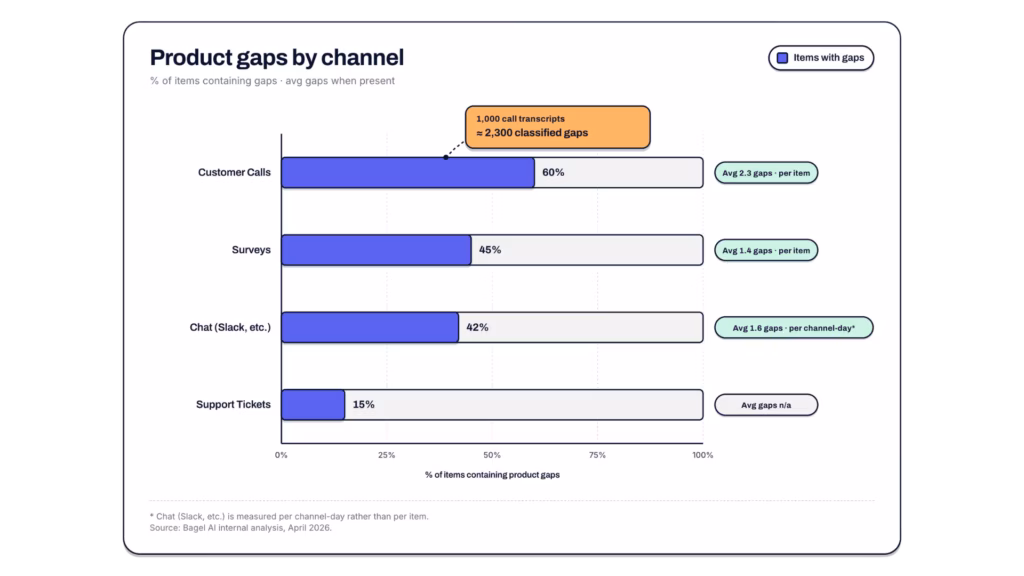
The call number is the one that should change how you think about your data. An LLM analyzing a CSV of 1,000 call transcripts sees 1,000 rows. The actual signal count is closer to 2,300 classified gaps, each tied to a specific product area. That’s not a rounding error. It’s the difference between a thematic summary and an accurate map of what your customers are telling you.
Raw LLM analysis doesn’t extract at this level. It can’t. The model doesn’t know your product structure, your customer segments, or which accounts have renewals next quarter. It produces thematic summaries that read like analysis but lack the connective tissue that turns observations into decisions.
The layer most teams are missing: from signal to decision
Here’s where the conversation about AI and product intelligence usually stops. Someone points out that raw LLM analysis isn’t great. Someone else points out that structured data helps. Everyone nods. The solution presented is always some version of “organize your feedback better and the AI will do a better job.”
This is true but incomplete. It addresses the data quality problem while missing the decision quality problem entirely.
Consider four levels of output from the same customer feedback data (illustrative examples):
Level 1 (raw LLM on CSV exports): “Integration requests are the most common theme across channels. Mid-market and Enterprise segments mention them most frequently. Sentiment around integrations is mixed, with some frustration visible. Recommend investing in integration partnerships and better documentation.”
Level 2 (structured feedback): “Integration gaps: 840 negative insights across 310 accounts representing significant ARR. Accounts with CSAT below 3.0 are hit hardest. Immediate renewal risk in Q2 cohort.”
Level 3 (product intelligence with decision context): “Integration gaps cluster around Salesforce and HubSpot in Enterprise accounts approaching renewal. 3 of the top 5 affected accounts overlap with the Q2 expansion pipeline. Shipping the Salesforce connector addresses 62% of these signals.”
Level 4 (execution-ready with roadmap context): “The Salesforce connector is scoped in the backlog but deprioritized since Q1. The HubSpot integration shipped in v3.12 last week and resolves 24% of related signals. Reopening the Salesforce scope with updated signal data and tying it to the 3 affected pipeline accounts gives your team a dev-ready brief this sprint.”
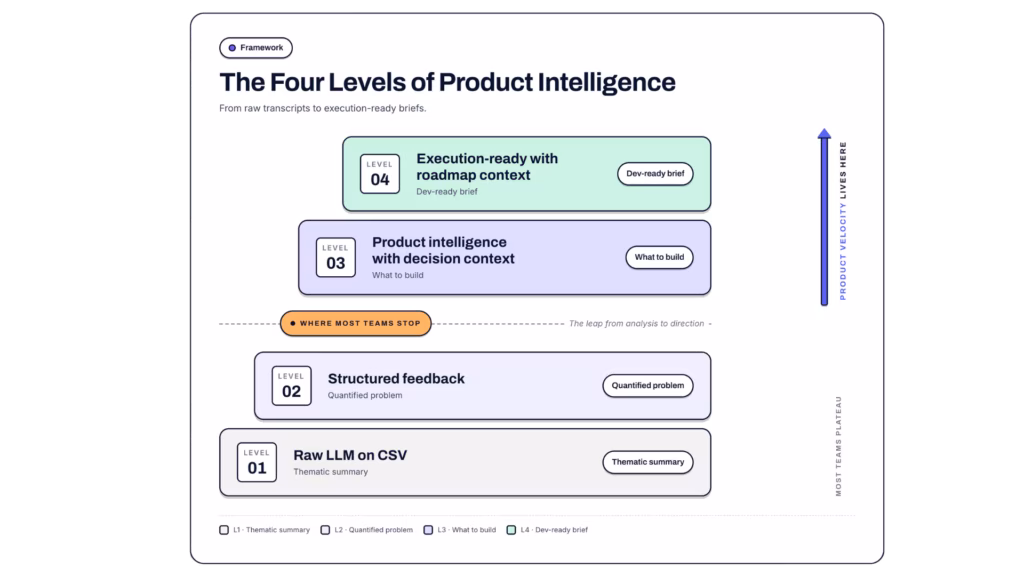
Level 1 tells you what’s broken. Level 2 quantifies the problem. Level 3 tells you what to build. Level 4 tells you what’s already done, what’s already planned, and where the new signal fits into work already in motion.
Most of the conversation in our industry stays at the boundary between Level 1 and Level 2. The argument is about whether your feedback is structured enough for AI to produce accurate thematic summaries. That’s a real problem worth solving. But it’s not the problem that determines whether your product team ships the right thing next sprint.
The gap between Level 2 and Level 4 is where product velocity lives. It’s the distance from signal to opportunity. It requires connecting customer signals to product areas, mapping those signals to revenue and retention impact, understanding trend velocity (is this getting worse?), and linking everything to the development priorities and roadmap your team is actually working against.
Organizing feedback better gets you from Level 1 to Level 2. It doesn’t get you to Level 4. You need product context: the relationship between what customers are telling you and what your team is building, has built, and is deciding whether to build next.
What product context actually means (technically)
Product context is a structured layer that connects three things most systems keep separate.
Customer signals: Every piece of feedback, classified not just by theme and sentiment but by product area, feature, and sub-feature. A single support ticket often contains multiple distinct signals. Across Bagel’s platform, a single customer call for a typical company averages 2.3 distinct product gaps. “The export is slow AND I can’t find the filter option AND your docs are outdated” is three separate gaps in one conversation. Flat CSV analysis treats this as one row, losing the granularity that makes prioritization possible.
Account and revenue context: Which customers are affected, what they’re worth, where they sit in the lifecycle, whether they’re approaching renewal or expansion, and who owns the relationship. The distance between “performance is an issue” and “performance is an issue for $2M in pipeline accounts renewing in Q2” is the distance between a backlog item and a board-level conversation.
Product structure: How feedback maps to your actual product architecture, your roadmap, and your development pipeline. When a customer says “it’s slow,” product context tells you whether they mean the dashboard load time (shipped a fix last sprint, monitoring) or the export pipeline (not in the backlog, worsening, affects your largest accounts). It also knows what you launched last week, what’s already queued, the taxonomy your R&D team uses internally, and which features are in active development. Without that layer, you’re prioritizing in a vacuum. With it, you know whether a signal requires new work, maps to something already in progress, or has already been addressed.
When these three layers connect, you get consistent results. Ask the same question twice, get the same answer. The system processes all your data on every query. And it returns decisions, not summaries.
This is the layer that turns AI from a summarization tool into a product intelligence system. Without it, you get clean-looking reports about problems. With it, you get dev-ready answers about what to build, for whom, and whether the work has already started.
The compounding problem
There’s a timing dimension that makes this more urgent than it appears.
Zendesk’s 2026 CX Trends report (surveying over 11,000 consumers and CX leaders across 22 countries) found that 85% of CX leaders say customers will drop brands that cannot resolve issues on first contact. High-maturity organizations, those with the most developed feedback-to-action practices, are 2x more likely to report boosted CSAT from their AI investments. And 74% of CX leaders say that without rapid AI adoption, their organization may struggle to stay competitive.
Those numbers compound. Teams with quick, reliable access to product context spend less time wrestling with data and more time acting on it. They validate more hypotheses, kill the wrong ones sooner, and double down on what works. Teams without it make fewer decisions – and less informed ones.
Teams without product context will keep getting polished thematic summaries from their AI tools. They’ll share them at leadership meetings. They’ll shape product strategy around them. And they’ll have no way to know the signal was unreliable, because the output will always read like it was written by someone who did the work.
Both approaches will feel like using AI for product intelligence. The difference shows up later, in what gets shipped, how fast, and whether it’s the right call.
The cost of confident wrong answers
This has a dollar value. Multiple dollar values, actually.
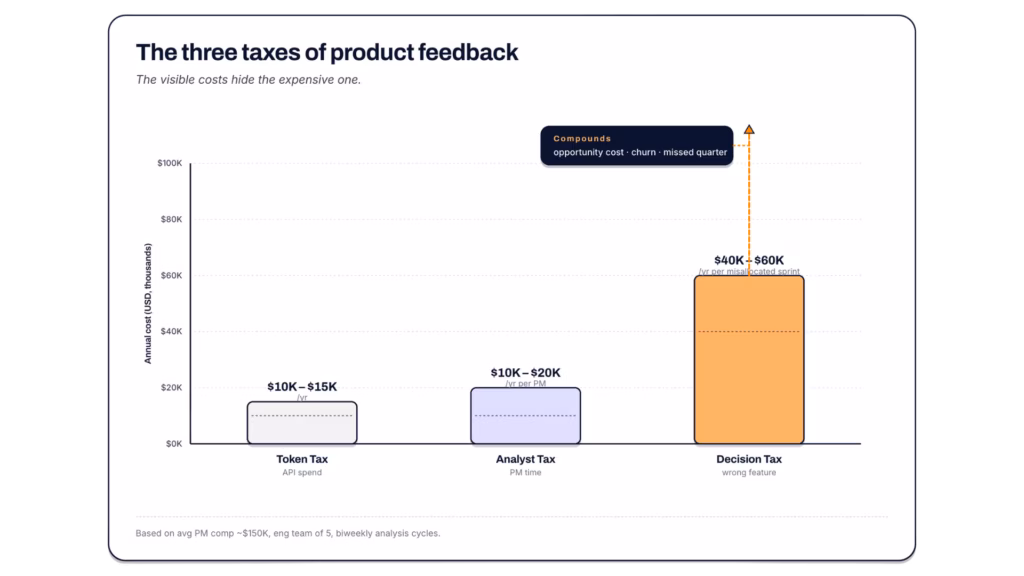
The token tax. Claude Sonnet 4.6 costs $3 per million input tokens and $15 per million output tokens. As a rough scenario: a dataset of 10,000 support tickets might run 3-5 million tokens as raw CSV (actual counts vary significantly by ticket length and structure; measure yours with a tokenizer before budgeting). A single analysis pass would cost $9-15 in input alone. But the real cost is what those tokens are spent on. Anthropic’s own context engineering guidance describes the core problem: the model’s attention budget is finite, and every token spent on retrieval is a token not spent on reasoning. In practice, teams don’t run one analysis. They run it across 10+ product areas, then re-run with different time horizons or refined hypotheses. That’s 20+ passes per cycle. Run that weekly and the annual API spend on raw-data analysis could reach $10,000-15,000. At that point the natural solution is connecting your data and building a RAG system. But that means engineering resources, infrastructure, and its own maintenance burden.
The analyst tax. The API cost is the visible line item. The invisible one is human time. A PM or analyst who exports tickets, writes prompts, reviews the output, cross-references with the CRM, and debates the results in a meeting is spending 4-8 hours per analysis cycle. The average US product manager earns approximately $150,000/year in total compensation, with senior PMs ranging from $122,000-$190,000. Add benefits and overhead (commonly estimated at 1.25-1.4x base compensation for US tech companies) and the fully loaded hourly cost lands at roughly$100/hour. At 4-8 hours per cycle, that’s $400-800 per analysis. Run it only biweekly and you’re looking at – $10,000-20,000/year in PM time spent on a workflow that produces directional summaries, not decisions. That’s a PM doing data wrangling that a system should handle.
The decision tax. This is the one that doesn’t fit in a spreadsheet but dwarfs the other two. A product team that ships the wrong feature because their feedback analysis was based on a fraction of the data and didn’t have the right product context, doesn’t just waste the engineering time. They waste the quarter. A single misallocated two-week sprint for a 5-person engineering team costs $40,000-60,000 in fully loaded salary (based on average software engineer compensation of $150,000-180,000/year plus overhead). That’s before you count the opportunity cost of what they should have built instead, the churn from customers whose actual pain went unaddressed, and the compounding effect of falling further behind on the signals that matter.
Run it backward: if your annual revenue is $10M and your retention drops even 5% because you’re building against inaccurate signal, that’s $500K in revenue you didn’t need to lose. Not because your team isn’t talented. Because the intelligence layer between customers and decisions wasn’t there.
| Cost type | Per cycle | Annual estimate | Assumption |
| Token tax (API spend) | $180-300 per cycle (20+ passes) | $10,000-15,000 | Weekly cycles, 10+ product areas, x2 for iteration |
| Analyst tax (PM time) | $400-800 per cycle | $10,000-20,000 per PM | Biweekly cycles, 4-8 hours per cycle at $100/hr |
| Decision tax (wrong feature) | $40,000-60,000 per misallocated sprint | Compounds | Per sprint, plus opportunity cost and churn |
What changes when product decisions have product context
The practical difference comes down to speed and confidence of decisions.
A product team without product context spends its Monday morning reviewing a thematic summary of last week’s feedback, debating whether “integrations” means the same thing across segments, manually cross-referencing with the CRM to figure out which accounts are affected, and guessing at priority based on volume when impact is what matters. The meeting ends with “let’s dig deeper” or “let’s survey them.”
A product team with product context walks into Monday morning knowing, for example, that Salesforce integration requests increased 23% week over week, concentrated in Enterprise accounts, that 3 of those accounts are in the Q2 pipeline, and that the HubSpot connector shipped last sprint already covers a portion of the related signals. The meeting ends with a decision.
The difference shows up in fewer meetings between signal and action. Fewer cycles of “let me pull the numbers.” Fewer product decisions made on intuition dressed up as analysis.
Every week you operate without this layer, you’re paying a silent tax. Not in dollars (though the token costs add up). In time. In decisions deferred. In confidence gaps filled with slides instead of signals. It compounds in the same way that product context compounds: quietly, invisibly, and in one direction.
The question that matters
The question isn’t whether to use AI for product intelligence. You already are, or you will be soon. The question is whether your AI spends its attention budget finding and sorting data or connecting signals to decisions.
The research is clear that raw LLM analysis of customer feedback produces outputs that look like insight but lack the accuracy, precision, and context required for product decisions. The context window limitations are architectural. The precision and recall problems are inherent to analysis of unstructured text. The sentiment accuracy gaps are well-documented.
The solution isn’t to wait for better models. The models keep improving and the problem remains. A larger context window doesn’t fix context rot. As Anthropic writes, the direction is context engineering, curating the right information during inference. For product teams, that means adding a layer of product context: your roadmap, your segments, your prior decisions, both during analysis and when connecting feedback to accounts, product areas, and development priorities.
That connection is the product intelligence layer. It’s what turns scattered signals into product velocity. And the teams building it now are making better product decisions every week while the gap quietly widens.
About the Author:
Neta Barkay is Head of Data & AI at Bagel AI. Previously a Research Scientist at Meta, she’s built her expertise at the intersection of applied research, data science, and business strategy. Her mission: precision in data, impact in business.